So here we are, on my second day of no coffee. I worked my consumption downward slowly over the course of six weeks. And I just had a thought: hey I wonder if anything interesting can be seen on my smart watch?
Here’s the last three months of sleep plotted by weekly average:
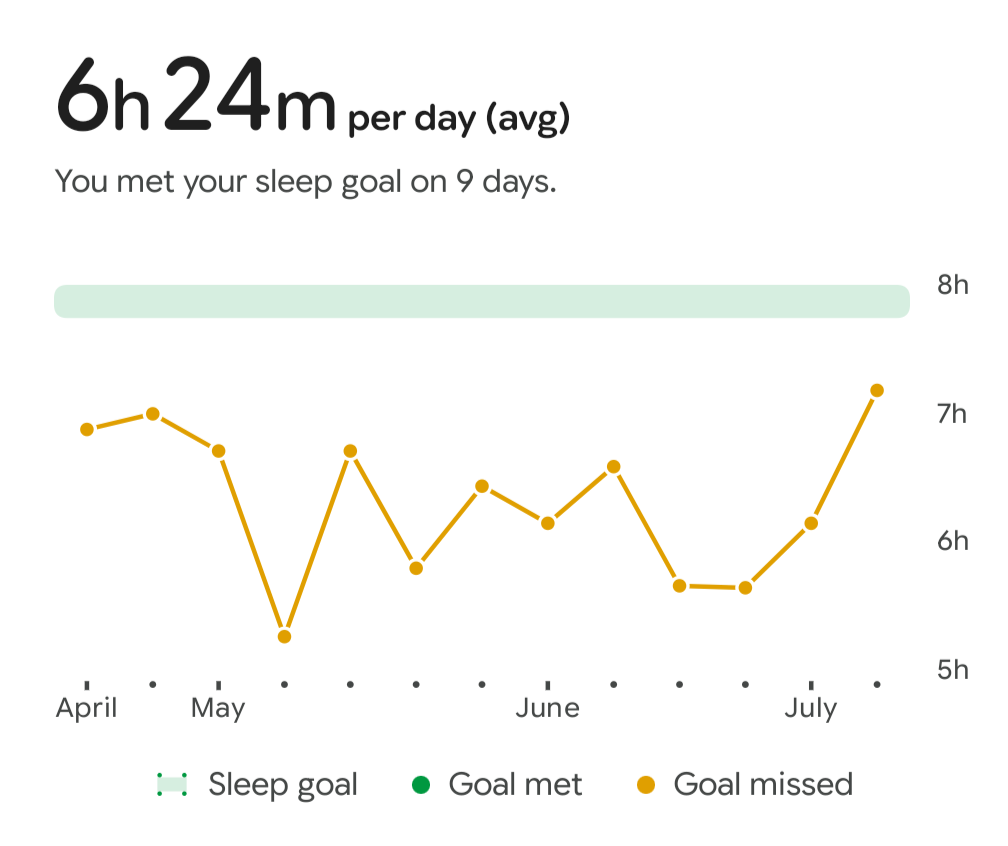
At first I didn’t think there was anything there because there’s so much up and down. But I couldn’t help notice the last 2 weeks look like something. In the entire chart, which is three months of data, I never have two consecutive weeks of rising sleep score. That’s kinda interesting. Because the last two weeks is when I was drinking the least amount of coffee. I even called it microdosing.
It will be fun to check back on this in a few weeks and see if it is consistently higher, or if it bops up and down. It’s only been 2 days of completely caffeine free, so we’ll come back to this…